Gantt Chart
Gantt charts are useful tools for project planning and scheduling. They help you estimate how long a project will take, determine the necessary resources, and plan the order in which tasks need to be completed. A Gantt chart provides a graphical illustration of a schedule that helps you plan, coordinate, and track specific tasks within a project.
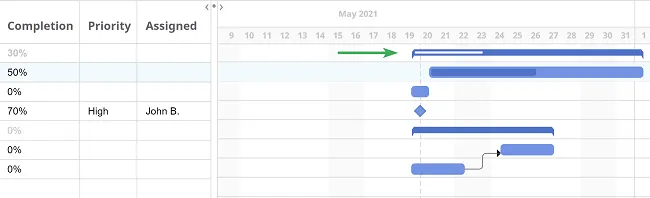
A Gantt chart is divided into two parts: the left side, which lists project details and task hierarchy, and the right side, where you add connections between tasks and monitor progress.
Create your Gantt chart
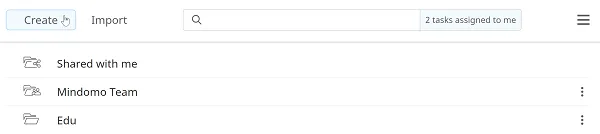
Section titled “Create your Gantt chart”To create a Gantt chart from scratch, go to Create from your Dashboard:
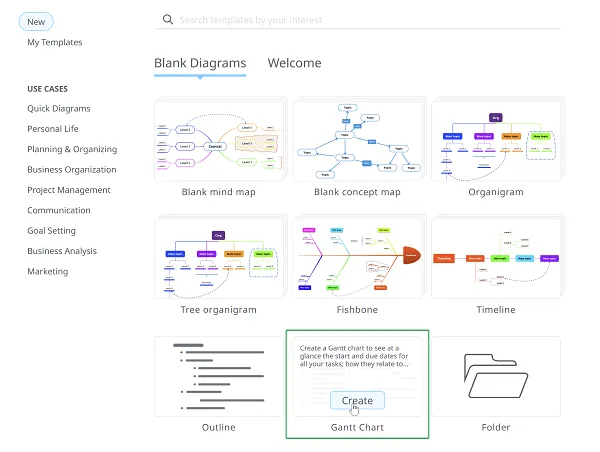
Then go to the Gantt Chart section and click Create.
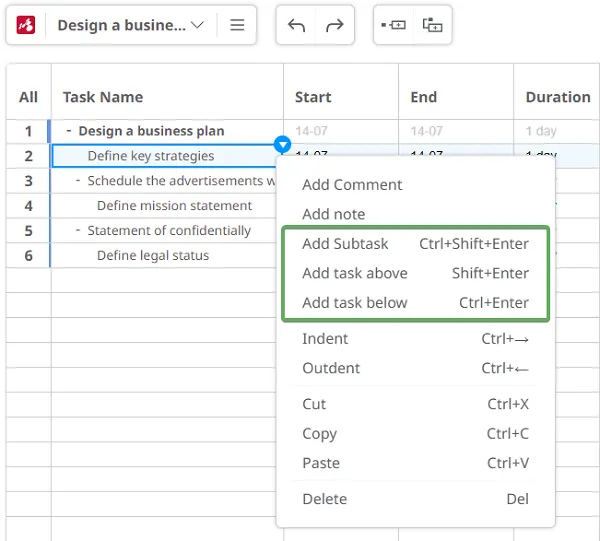
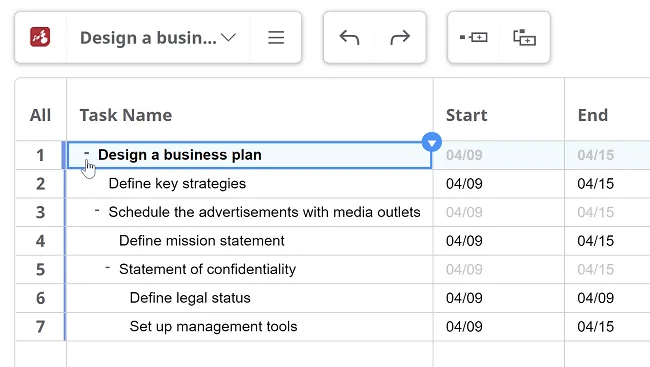
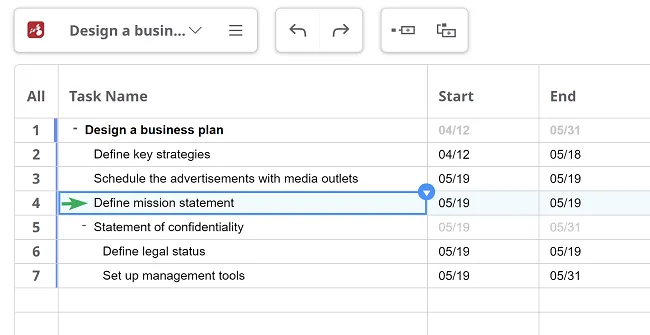
To build your Gantt chart, use a work breakdown structure. Use the TAB and ENTER keys to create tasks and subtasks and give each a title. Alternatively, new tasks can be added from the main task’s context menu.
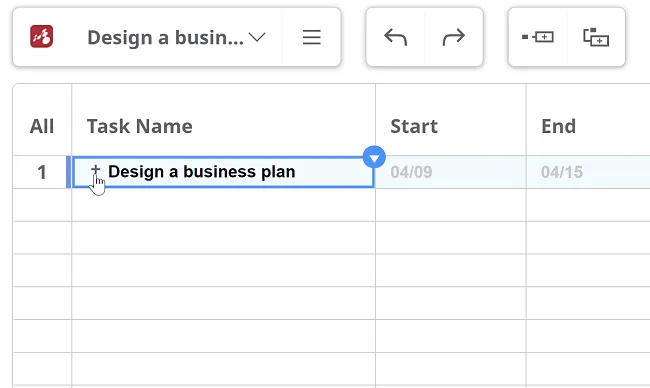
Each main task acts as a summary task, with the entire project being the first summary task in the top row. Summary tasks group project tasks and subtasks, giving you a clear overview of dependencies.
If a main task has subtasks, you can expand or collapse it by clicking the “+” or “–”.
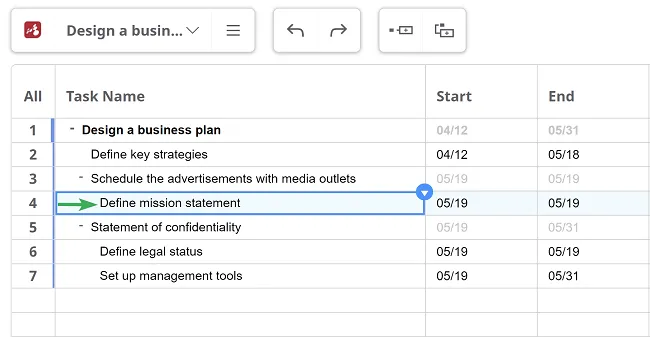
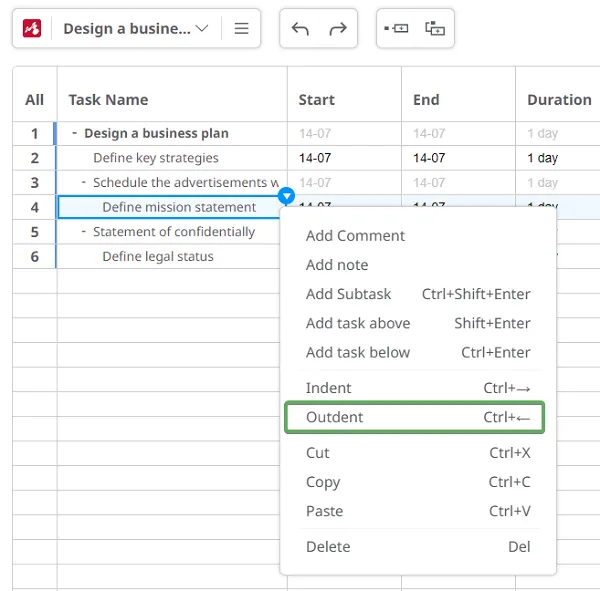
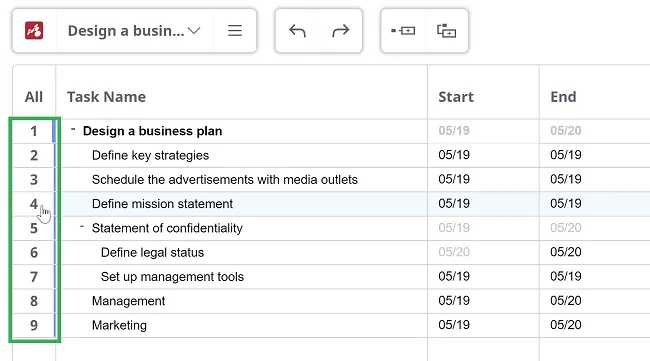
Use the Indent and Outdent options to adjust the task hierarchy. You can turn tasks into subtasks and vice versa.
- Click Indent to level down a topic or subtopic (or use Ctrl + →).
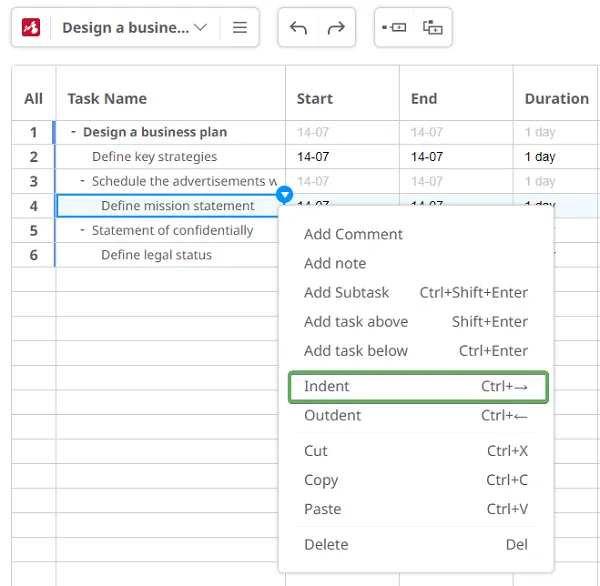
- Click Outdent to level up a topic or subtopic (or use Ctrl + ←).
Edit your Gantt chart
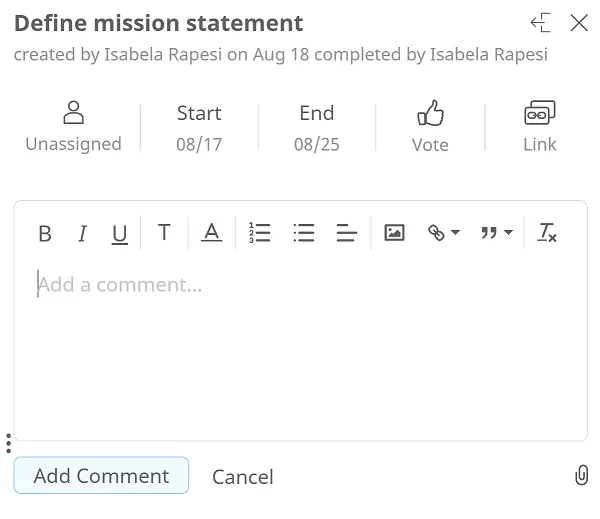
Section titled “Edit your Gantt chart”Click the numbering of any task to open the Comments panel and add notes, guidelines, or reviews.
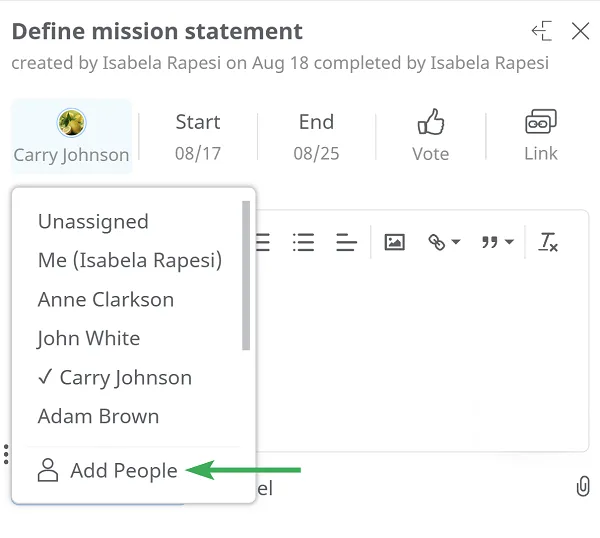
The Comments panel contains all task information, such as deadlines, duration, completion percentage, and assigned users.
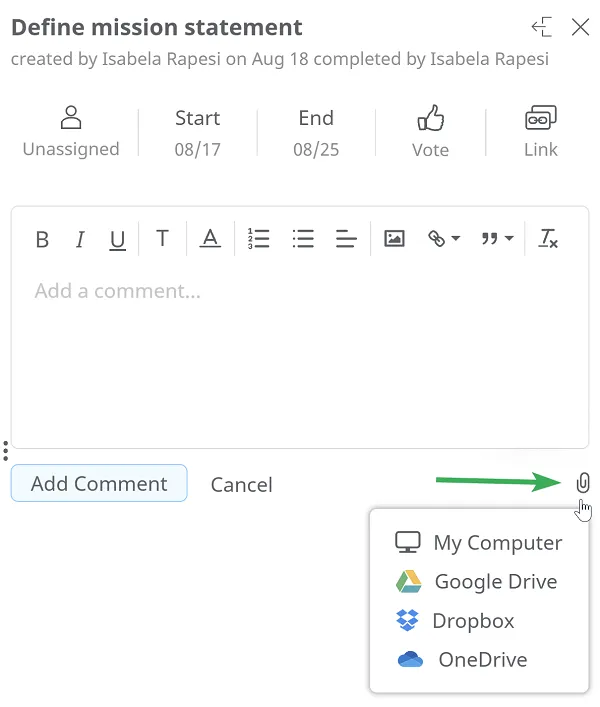
You can also add additional resources (images, videos, files) from your computer, Google Drive, or Dropbox.
To assign a task, click Add people. You will be redirected to the Share page, where you can enter the email addresses of collaborators. Assigned users will appear in the Assigned tab.
Set a schedule
Section titled “Set a schedule”Set a task’s timeframe by opening the calendar and selecting the Start and End dates.
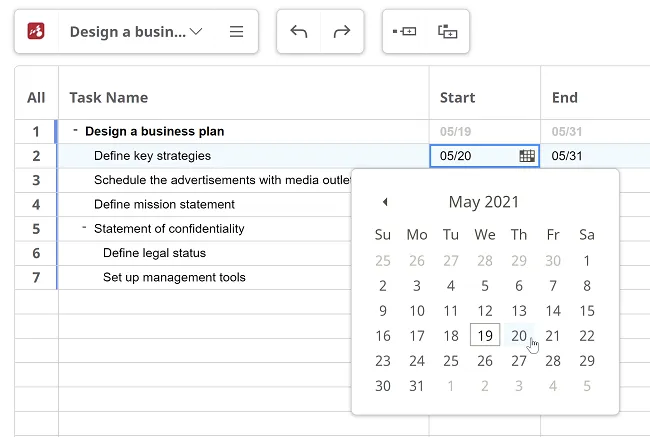
The timescale is automatically calculated in days and shown in the Duration tab.
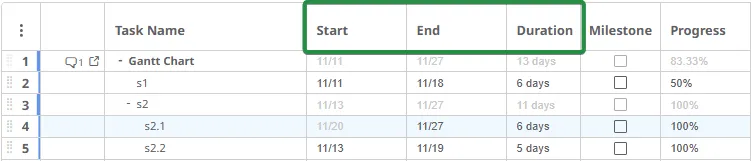
Tasks should be completed within a defined timeframe or by a specific deadline. Each subtask also has its own start and end dates or deadline.
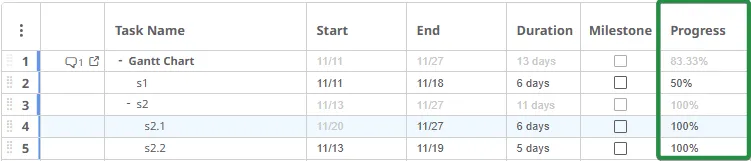
Task progress is set manually as a percentage in the Progress tab. Changes in subtask progress automatically update the progress of the main task.
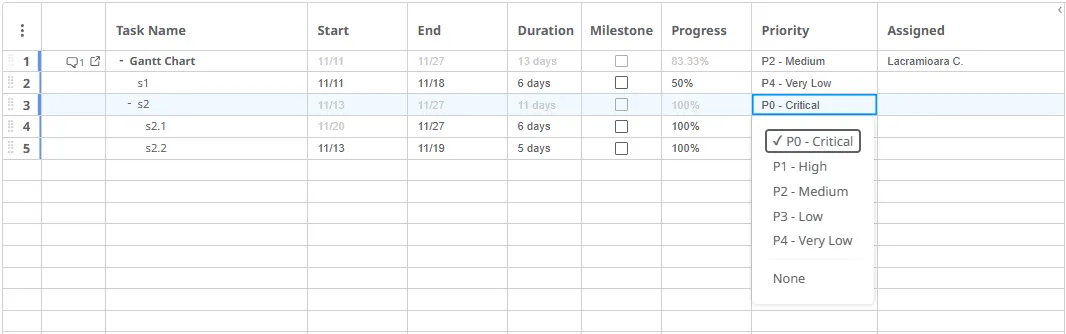
Each task contributes to the overall execution of the project, and its importance can be set in the Priority tab. Double-click a task row and choose from the available priority levels (from Very low to Critical).
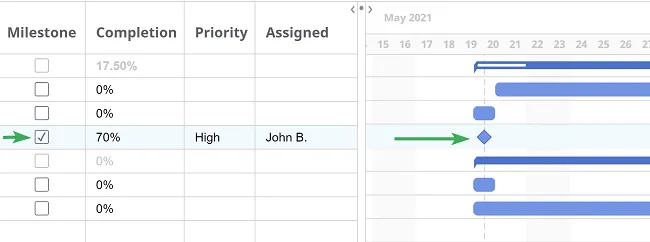
The Milestone option appears as a diamond-shaped symbol on the chart. Milestones mark significant project dates, such as important events or goals. Use them to highlight key moments or review meetings.
Create connections between tasks
Section titled “Create connections between tasks”On the right side of the Gantt chart, you can add dependencies to show how tasks relate to one another.
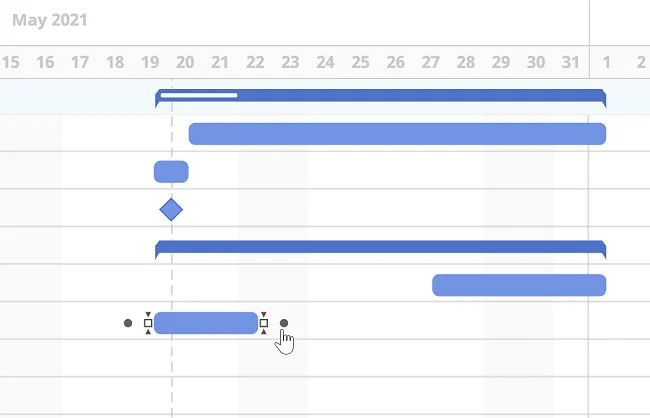
Click a task bar, hold the mouse on the black dot, and drag it to another task bar to create a dependency.
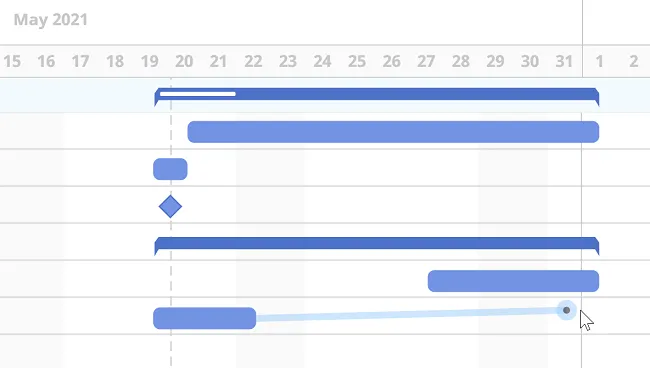
Dependencies show the order in which tasks must be completed. Some tasks cannot start until others are finished, and some cannot be completed until preceding tasks are done.
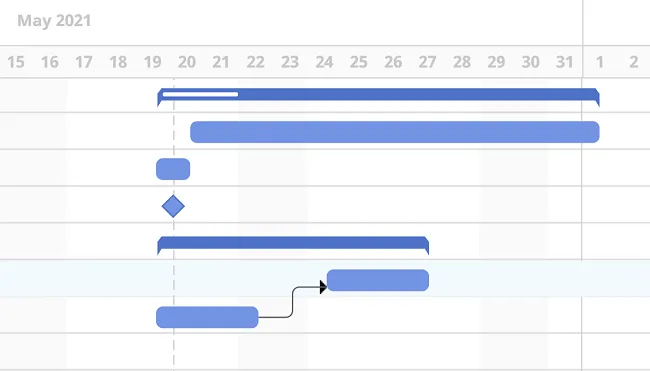
Each main task has a progress bar that updates automatically based on the overall completion of its subtasks. Completed parts appear in white, while the remaining work is shown in a darker shade of blue.
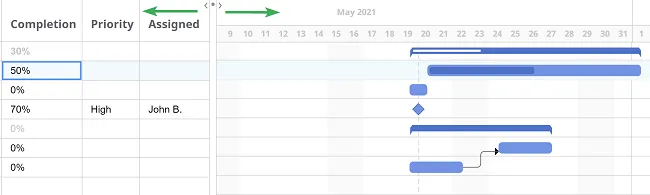
You can hide the task list tabs by dragging the vertical line that separates the two sections.
Update your Gantt chart whenever changes occur. This keeps your project up to date and ensures that everyone is aligned. When you reschedule a task with dependencies, all related tasks are automatically adjusted.
Email notifications
Section titled “Email notifications”- When a task is completed, the task creator receives an email notification.
- Assignees are notified when new comments, files, or changes appear on their tasks.
- Notifications for tasks due or starting today or tomorrow are sent once a day, in the morning.
- Notifications for tasks due or overdue in the current week are sent once a week, on Monday morning.
Collaborate in real time
Section titled “Collaborate in real time”Effective project management requires continuous team collaboration. Mindomo allows you to create shareable, collaborative Gantt charts. As team members update tasks, the entire project plan refreshes automatically and in real time for everyone.
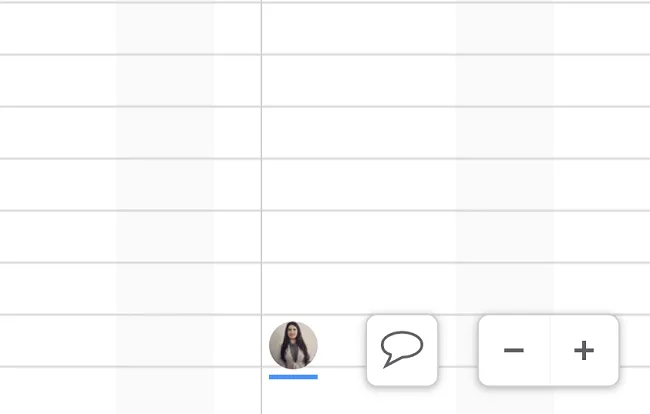
A pop-up notification appears when a new user joins the Gantt chart, and active collaborators are shown in the bottom-right corner.
Change the view of your Gantt chart
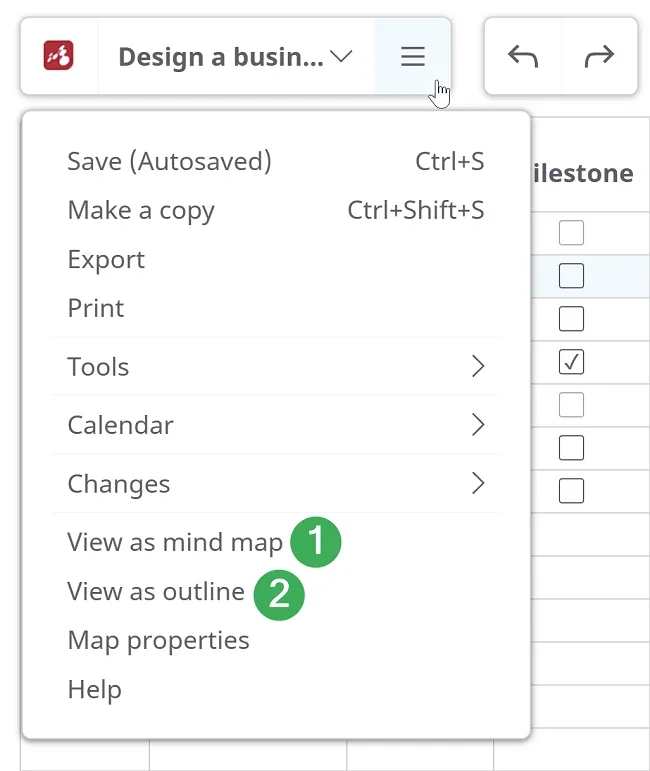
Section titled “Change the view of your Gantt chart”You can switch your Gantt chart to a Mind Map view (1), where the first summary task becomes the central topic and all other tasks become topics and subtopics according to their hierarchy.
You can also convert it to an Outline view (2). Use the left toolbar to change the view mode.
All details such as schedules, assignees, and attached resources are preserved when switching views.